📋 Table of Contents
Knowing how tax brackets operate is one of the most important concepts for successful financial planning. Many taxpayers do not clearly comprehend how tax brackets operate, and as such, they lose tremendous financial planning and savings opportunities. This guide is intended to provide insight into how the 2026 federal tax brackets operate and provide actionable strategies to minimize your tax liability.
What Are Tax Brackets?
The concept of tax brackets is a range of income, each corresponding to a specific rate of taxation. In the USA, there are seven ranges, and they have rates between 10% and 37%. As one earns more, some of that income is taxed progressively. However, only some of the income within a specific range is taxed according to its rate.
When you think about it, tax brackets are like stairs—you walk up the stairs step by step. Each "step" (tax bracket) has its own tax rate, and you only pay that tax rate on income in that step alone. Thus, it is always vital to understand tax brackets because it dispels the myth that earning more automatically means paying significantly more in taxes proportionally.
The tax brackets are adjusted each year according to the inflation level and are announced by the IRS in October or November for the next year. This adjustment avoids "bracket creep," which means that inflation pushes people into higher tax brackets despite their actual income not increasing in real terms.
Important Related Terms
- 🔹 Marginal Tax Rate: It is the tax rate on the last dollar earned.
- 🔹 Effective Tax Rate: Average amount of tax levied on total income.
- 🔹 Taxable Income: The amount that remains after deductions and exemptions; tax brackets are applied here, not to the original income.
- 🔹 Standard vs. Itemized Deductions: Help lower income, keeping taxpayers in lower tax brackets.
2026 Federal Tax Bracket Tables
Here are the official 2026 tax brackets for each filing status. Note that these are for the 2026 tax year (taxes filed in 2027).
Single Filers
| Tax Rate | Taxable Income Range | Tax Owed |
|---|---|---|
| 10% | $0 to $11,925 | 10% of taxable income |
| 12% | $11,926 to $48,475 | $1,192.50 + 12% of income over $11,925 |
| 22% | $48,476 to $103,350 | $5,579.50 + 22% of income over $48,475 |
| 24% | $103,351 to $197,300 | $17,652 + 24% of income over $103,350 |
| 32% | $197,301 to $250,525 | $40,200 + 32% of income over $197,300 |
| 35% | $250,526 to $626,350 | $57,232 + 35% of income over $250,525 |
| 37% | Over $626,350 | $188,770.75 + 37% of income over $626,350 |
Married Filing Jointly
| Tax Rate | Taxable Income Range | Tax Owed |
|---|---|---|
| 10% | $0 to $23,850 | 10% of taxable income |
| 12% | $23,851 to $96,950 | $2,385 + 12% of income over $23,850 |
| 22% | $96,951 to $206,700 | $11,157 + 22% of income over $96,950 |
| 24% | $206,701 to $394,600 | $35,302 + 24% of income over $206,700 |
| 32% | $394,601 to $501,050 | $80,398 + 32% of income over $394,600 |
| 35% | $501,051 to $751,600 | $114,462 + 35% of income over $501,050 |
| 37% | Over $751,600 | $202,154.50 + 37% of income over $751,600 |
How Progressive Taxation Works
The progressive tax system implies that individuals in higher tax brackets will contribute more of their income to taxes. However, these individuals will not pay taxes on all of this salary; rather, they will pay taxes only on a portion of it above a threshold. Now, let's look at an example:
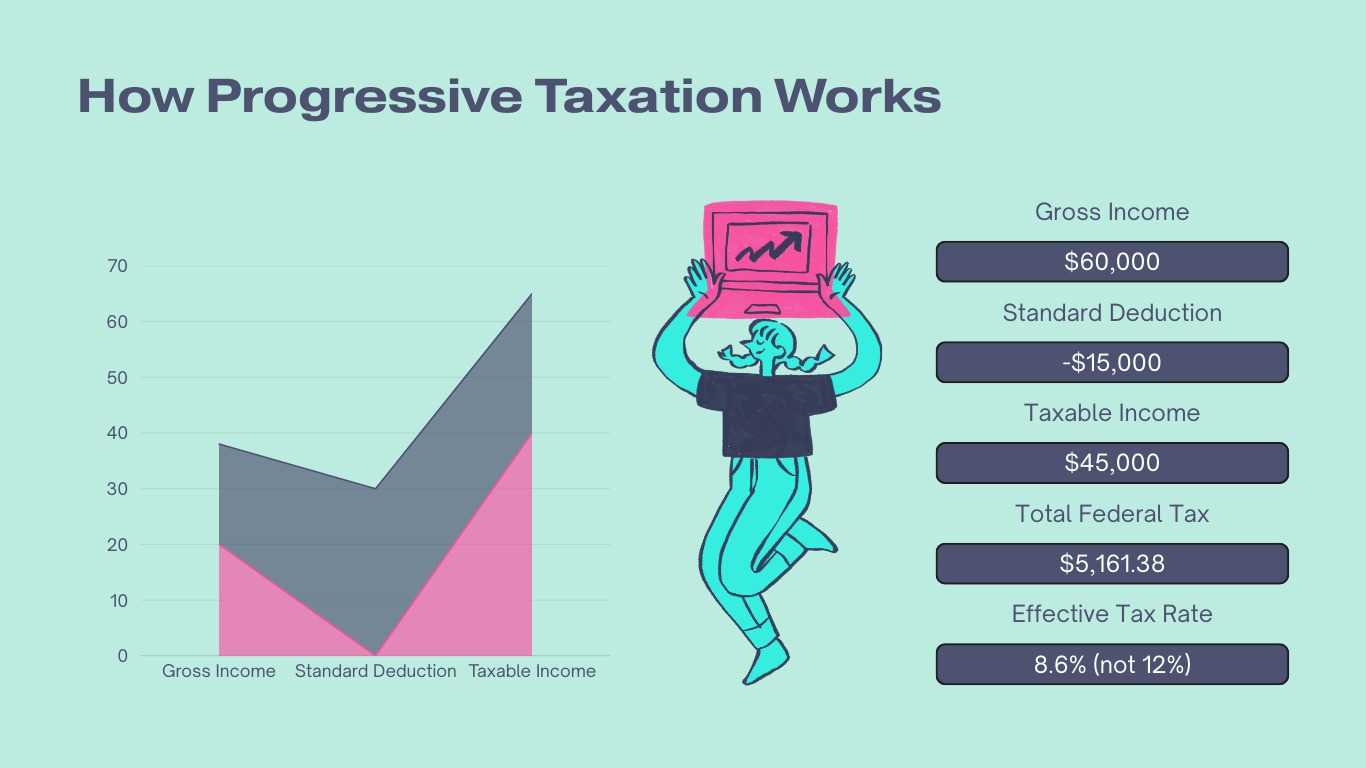
Example: $60,000 Income (Single Filer)
Step 1: Calculate Taxable Income
- Gross Income: $60,000
- Standard Deduction: −$15,000
- Taxable Income: $45,000
Step 2: Apply Tax Brackets
| Income Portion | Tax Rate | Tax Amount |
|---|---|---|
| First $11,925 | 10% | $1,192.50 |
| Remaining $33,075 | 12% | $3,969.00 |
Total Federal Income Tax = $5,161.50
Step 3: Determine Tax Rates
- Marginal Tax Rate: 12% (rate applied to the last dollar earned)
- Effective Federal Tax Rate: $5,161.50 ÷ $60,000 = 8.6%
This shows why the effective rate is always lower than the marginal rate in progressive systems.
Step 4: Add Payroll Taxes (Realistic View)
Most employees also pay FICA payroll taxes (7.65%):
- 7.65% × $60,000 = $4,590
Total Estimated Taxes (Income + Payroll): $5,161.50 + $4,590 = $9,751.50
Overall Effective Tax Rate (Total Taxes): $9,751.50 ÷ $60,000 = 16.3%
Estimated Take-Home Pay: $60,000 − $9,751.50 ≈ $50,248
Marginal vs. Effective Tax Rates
| Marginal Tax Rate | Effective Tax Rate |
|---|---|
|
The tax rate applied to your last dollar of income. This is the bracket you "fall into" and influences decisions about additional income. For example, if you're in a 22% bracket, all additional income will be taxed at 22%. Marginal Rate = Rate on next dollar earned
Example: If your income places you in the 22% bracket, earning an extra $1,000 means roughly $220 additional tax, not 22% of your entire salary. |
Your average tax rate, or total taxes paid divided by total income. This is always less than your marginal tax rate and indicates what percent of your income is actually being used for taxes. Effective Rate = Total Taxes Paid ÷ Total Gross Income
Example: If you earn $80,000 and pay $12,000 total taxes: Effective rate = 12,000 ÷ 80,000 = 15% — even if your marginal bracket is 22%. |
Tax Planning Strategies Based on Brackets
💰 Strategy 1: Maximize Deductions Near Bracket Thresholds
If you're near a threshold (e.g., earning $48,000 when the 22% rate begins at $48,475), make extra 401(k) contributions or charitable donations to stay in the lower bracket.
📊 Strategy 2: Income Smoothing Over Multiple Years
If you think you are going to receive a jump in income (bonus, stock options), you might want to consider delaying income into the next year to avoid bracket creep.
🎯 Strategy 3: Strategic Roth Conversion
In low-income years, consider converting your Traditional IRA assets to a Roth IRA up to the top of your bracket to pay taxes at a lower rate than you will later in your life.
⚡ Strategy 4: Timing Capital Gains
Long-term capital gains have their own brackets (0%, 15%, and 20%). Sell investments during years when income is low and lock in potential 0% taxes on capital gains.
Calculate Your Exact Tax Liability
Use our free calculator to see exactly how much you'll pay in taxes based on 2026 brackets.
Calculate My Taxes →Real-World Examples by Income Level (How Tax Brackets Work)
Assumptions: Single filer, standard deduction $15,000, U.S. federal brackets used for illustration. FICA estimated at 7.65% unless income exceeds Social Security cap.
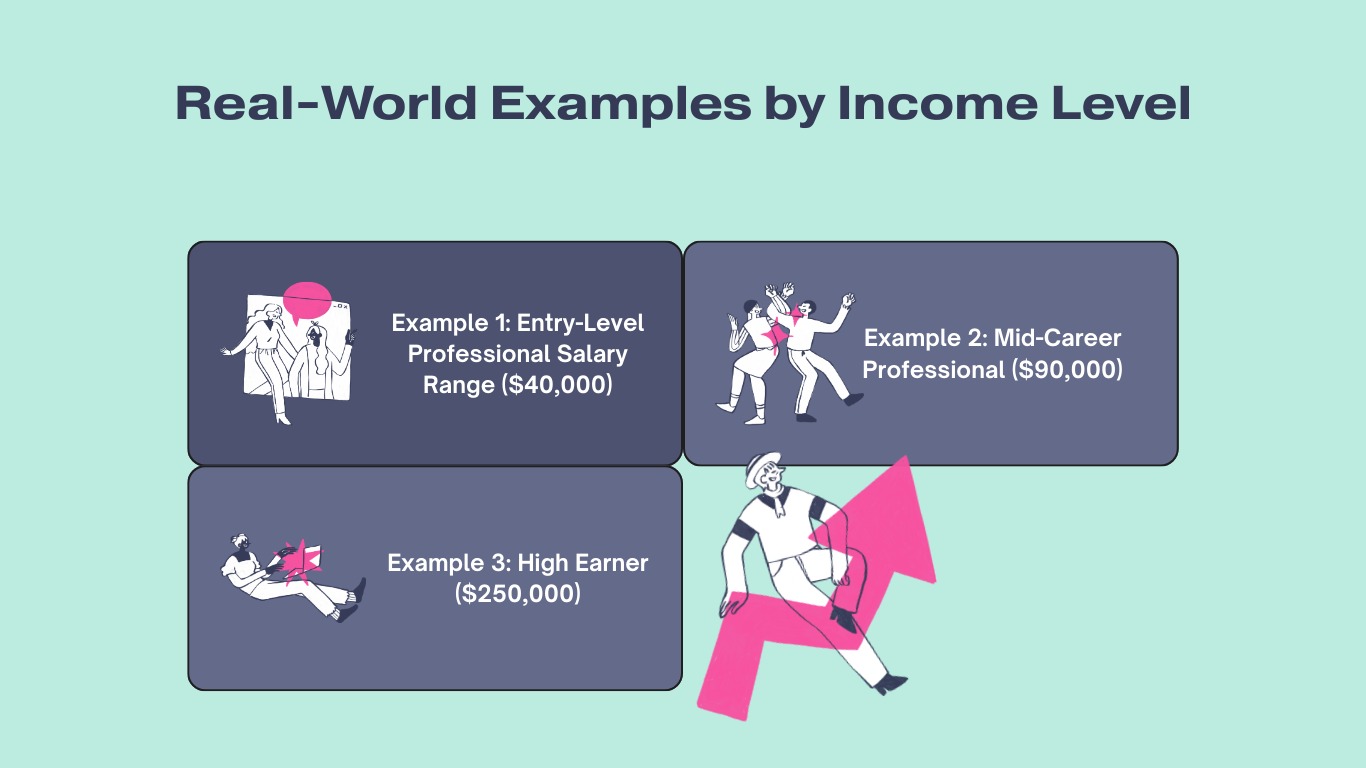
📗 Example 1: Entry-Level Professional — Salary $40,000
Situation: Recent college graduate, single
- Gross Income: $40,000
- Standard Deduction: $15,000
- Taxable Income: $25,000
Federal Tax Calculation
- 10% on first $11,000 = $1,100
- 12% on remaining $14,000 = $1,680
Total Federal Tax = $2,780
Payroll Taxes (FICA)
7.65% of $40,000 = $3,060
- Total Taxes: $5,840
- Effective Tax Rate: 14.6% (total taxes)
- Federal Effective Rate Only: 6.9%
- Estimated Take-Home Pay: ~$34,160
📘 Example 2: Mid-Career Professional — Salary $90,000
Situation: Single filer, stable career
- Gross Income: $90,000
- Deduction: $15,000
- Taxable Income: $75,000
Federal Tax
- 10% first $11,000 = $1,100
- 12% next $33,725 = $4,047
- 22% remaining $30,275 = $6,661
Total Federal Tax = $11,808
FICA
7.65% of $90,000 = $6,885
- Total Taxes: $18,693
- Effective Tax Rate (total): 20.7%
- Federal Effective Rate Only: 13.1%
- Estimated Take-Home Pay: ~$71,307
📙 Example 3: High Earner — Salary $250,000
Situation: Senior executive
- Gross Income: $250,000
- Deduction: $15,000
- Taxable Income: $235,000
Federal Tax
- 10% first $11,000 = $1,100
- 12% next $33,725 = $4,047
- 22% next $50,650 = $11,143
- 24% next $86,725 = $20,814
- 32% remaining $52,900 = $16,928
Total Federal Tax ≈ $54,032
Payroll Taxes
- Social Security (6.2% capped approx.) ≈ $9,932
- Medicare 1.45% = $3,625
- Additional Medicare 0.9% (over $200k) ≈ $450
Total Payroll Taxes ≈ $14,007
- Total Taxes: ~$68,039
- Effective Tax Rate (total): 27.2%
- Federal Effective Rate Only: 21.6%
- Estimated Take-Home Pay: ~$181,961
Key Learning Points
- Marginal tax rate = rate applied to the last dollar earned (12%, 22%, 32% etc.)
- Effective tax rate = total tax ÷ total income (always lower than marginal).
- Higher income does NOT mean all income is taxed at the highest bracket — only the portion above each threshold is taxed at higher rates.
- Payroll taxes (FICA / Medicare) significantly affect real take-home income.
Frequently Asked Questions
❓ Will I lose money if I earn more and move to a higher bracket?
No! Only the income above each threshold is taxed at the higher rate. Your previous income is still taxed at the lower rates. You always take home more when you earn more.
❓ How do I know which bracket I'm in?
Your bracket is determined by your taxable income (gross income minus deductions), not your gross salary. Use our calculator above or check the IRS tables with your estimated taxable income.
❓ Do tax brackets include state taxes?
No, these are federal brackets only. Most states have separate income tax systems with their own brackets. Check our state tax calculators for your specific state.
✅ Key Takeaways
- Tax brackets are progressive; only income within each range is taxed at that rate
- Your effective tax rate is always lower than your marginal rate
- Earning more money never reduces your total take-home pay
- Strategic planning around bracket thresholds can save thousands annually
- Brackets are adjusted annually for inflation by the IRS
- Understanding brackets empowers better financial decisions